

US DOLLAR FORECAST
- U.S. dollar gains ahead of a major U.S. inflation report on Tuesday
- CPI data may help guide the Fed’s policy outlook for 2023
- This article looks at key USD/JPY’s technical levels to watch in the coming sessions
Recommended by Diego Colman
Get Your Free USD Forecast
Most Read: Gold Prices on Shaky Ground Ahead of US Inflation Data and Key Fed Decision
The U.S. dollar, as measured by the DXY index, strengthened modestly on Monday, boosted by higher U.S. Treasury yields. In late afternoon trading, the greenback gauge was up about 0.15% to 103.75, rising for the second straight day amid market caution ahead of U.S. inflation data.
The U.S. Bureau of Labor Statistics is scheduled to release the May consumer price index survey on Tuesday morning.
Annual headline CPI is seen falling to 4.1% from 4.9% in April, dragged down by lower energy costs following oil’s downward correction last month. However, core CPI, which reflects longer-term trends in the economy and is closely tracked by central bank officials, may show less moderation and little directional improvement, cooling only to 5.3% from 5.5% previously.
Persistently sticky underlying price pressures may compel the Fed to retain a hawkish stance this week, even if it ultimately votes to hold rates steady at its June meeting. For example, a “pause” could be accompanied by more aggressive dot-plot projections, including a higher terminal rate and no easing through 2024. This scenario should be bullish for the U.S. dollar.
There will be more information and data to better assess the FX outlook later this week, but the stars seem to be aligning for further U.S. dollar strength and, more importantly, increased volatility in the coming sessions. This can create attractive opportunities for traders looking for big swings in the major currency pairs, but also more risk, so caution is warranted.
Recommended by Diego Colman
How to Trade USD/JPY
USD/JPY TECHNICAL ANALYSIS
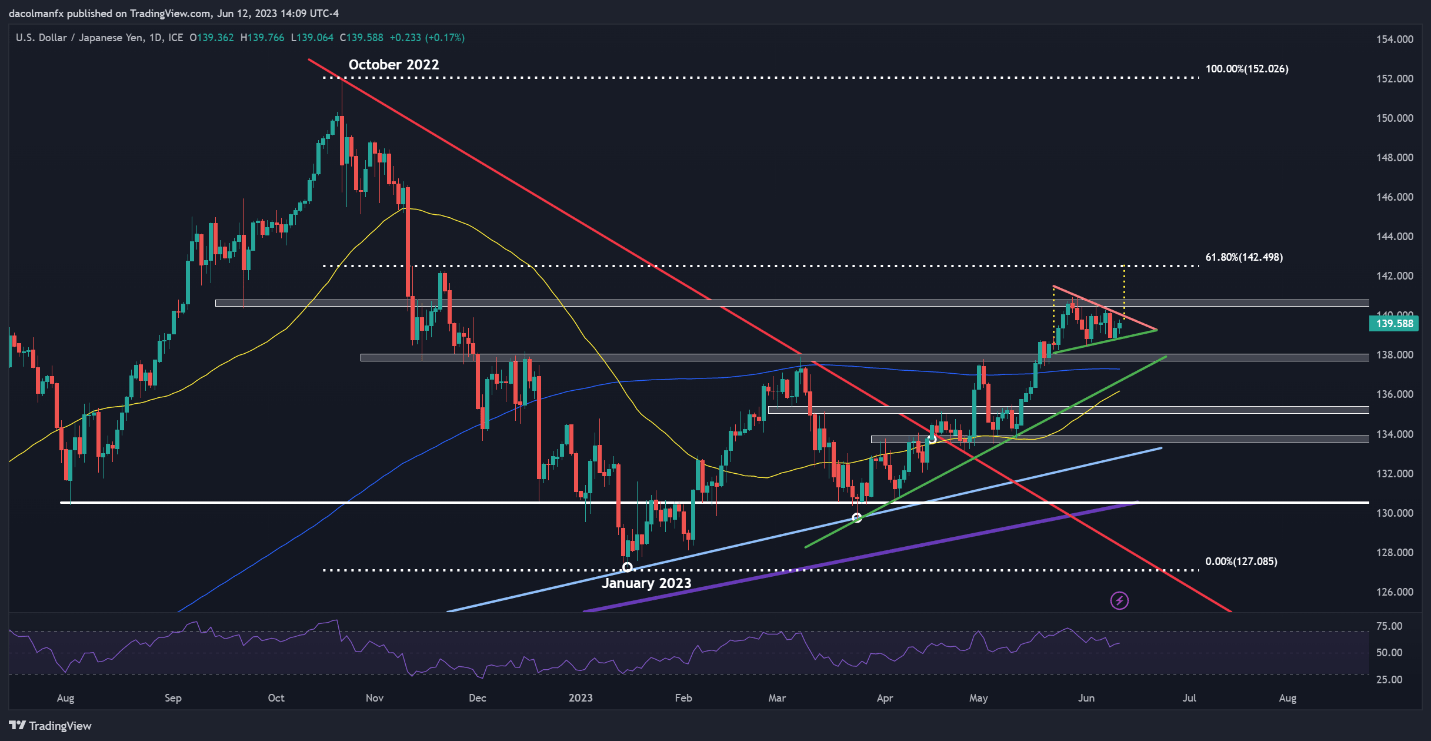
USD/JPY (U.S. dollar – Japanese yen) has been in an uptrend since late March, but bullish momentum has been weakening in recent weeks, with prices in consolidation mode while coiling in a potential symmetrical triangle.
A symmetrical triangle, composed of two converging trend lines, an ascending one connecting a sequence of higher highs and a descending one linking a series of lower lows, is usually considered a continuation pattern once confirmed.
This setup is validated once prices breach the triangle, especially if the move is in the direction of the prevailing trend. In the case at hand, USD/JPY may be able to accelerate higher if it manages to break out on the topside, clearing resistance at 140.00. Should this scenario play out, we could see a move toward 140.70, followed by 142.50, the 61.8% Fib retracement of the Oct 2022/Jan 2023 selloff.
In the event of a setback, initial support rests at 138.80. If sellers are successful in taking out this floor, USD/JPY may soon revisit 138.00 prior to a possible retest of the 200-day simple moving average.
| Change in | Longs | Shorts | OI |
| Daily | 0% | 4% | 3% |
| Weekly | 4% | -3% | -1% |
USD/JPY TECHNICAL CHART

