
The LT wave had a poor month for December.
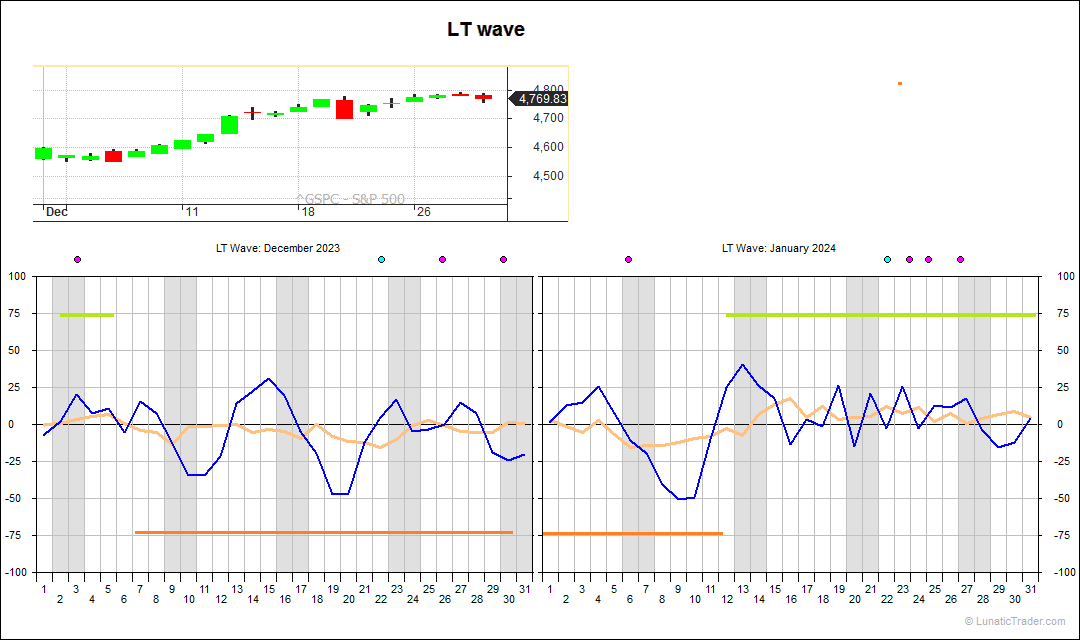
Projected strength in the first week only gave some sideways. The mildly negative values for the rest of December did not trigger any downside and the market kept climbing, be it a bit slower than it did in November. The stronger days did come around the 13th (as given by the blue line), so it was not all wrong. But the bigger picture (orange line) clearly got it wrong there. Here is the LT wave for January:
Overall we have weakness until the 11th or 12th. But we could get a few strong days in the first week, based on the blue line strength. After the weekend of the 13th we see mostly mildly positive values.
Normal caveats apply: the LT wave is experimental and purely based on natural cycles, so doesn’t use any market or price inputs. Don’t bet the farm on it.
Subscribe to our blog if you want to get an email each time we post new information. It’s free.
Join 961 other subscribers

