

Gold, US Dollar, Treasury Yields, Fedspeak – Asia Pacific Market Open:
- Gold prices fell on Thursday as US Dollar and bond yields rose
- Hawkish Fedspeak and US jobless claims data cooled pivot bets
- Asia-Pacific risk aversion may spell more trouble for XAU/USD
Recommended by Daniel Dubrovsky
Get Your Free Gold Forecast
Asia-Pacific Market Briefing – Gold Prices Sink as Treasury Yields Climb
Gold prices sank 0.77% on Thursday which was the worst single-day performance in almost one week. The yellow metal sank as the US Dollar and front-end Treasury yields climbed during the Wall Street trading session. XAU/USD tends to function as the anti-fiat trading instrument in financial markets. That is because of its lack of yield when holding the precious metal outside of expected returns.
XAU turned lower following a couple of notable events. The first is that we had commentary from Federal Reserve Bank of Richmond President Thomas Barkin. He said that it is important to continue tightening to rein in inflation. We also had weekly US jobless claims cross the wires. While the 196k outcome was higher than the 190k estimate, it remains historically low.
All this continues to pour cold water on market expectations that the central bank will pivot to interest cuts later this year. This follows last week’s non-farm payrolls report blowout, which underscored a relatively tight labor market that might be able to withstand the most aggressive tightening in decades. Since then, the markets have been pricing rate hikes back in.
Friday’s Asia-Pacific trading session is notably quiet in terms of economic data. That may continue allowing general risk appetite to set the tone for markets. If bond yields and the US Dollar continue climbing, this may pressure gold prices heading into the University of Michigan sentiment data later today. A higher-than-expected print would likely further compound this dynamic.
Gold Technical Analysis
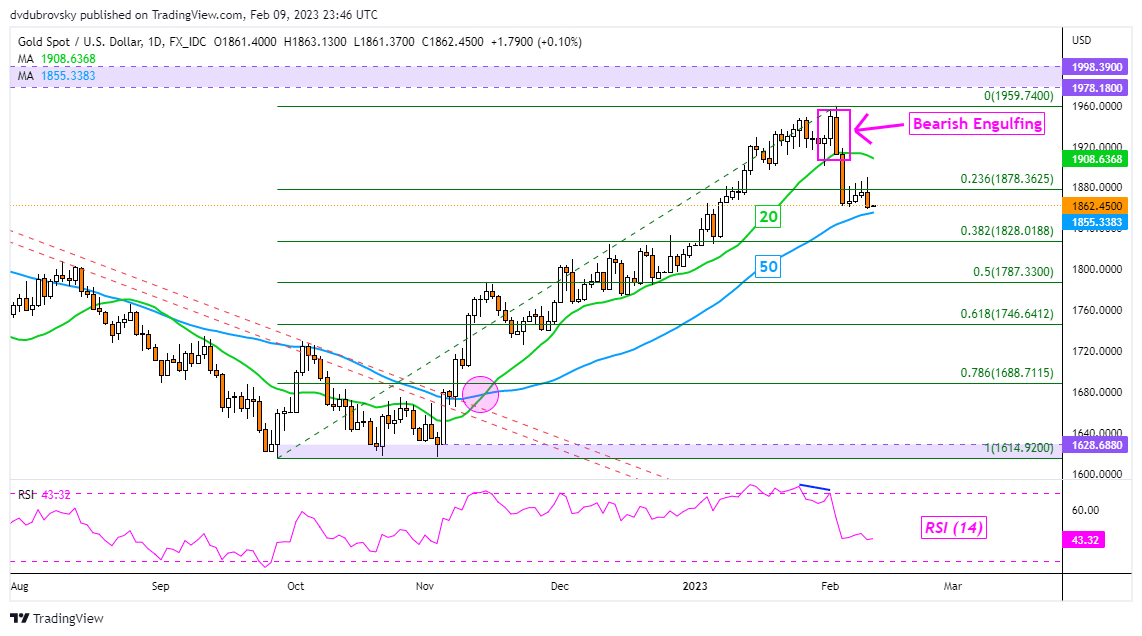
On the daily chart, gold has closed at its lowest since January 6th, just barely taking out lows from earlier this week. Still, prices remain above the 50-day Simple Moving Average (SMA). The latter may hold as support, maintaining the upside focus. That would undermine the Bearish Engulfing from earlier this month. Otherwise, extending lower would increasingly offer a bearish posture.
Recommended by Daniel Dubrovsky
Get Your Free Top Trading Opportunities Forecast
XAU/USD Daily Chart
— Written by Daniel Dubrovsky, Senior Strategist for DailyFX.com
To contact Daniel, follow him on Twitter:@ddubrovskyFX

