

Gold (XAU/USD) Technical Analysis
- Gold breakdown analysis and levels to note
- Retest of recent level of support (now resistance) adds to the bearish outlook
- Momentum via the MACD supports lower prices while the RSI suggests more room to the downside is possible
- The analysis in this article makes use of chart patterns and key support and resistance levels. For more information visit our comprehensive education library
Recommended by Richard Snow
How to Trade Gold
Gold Breakdown Analysis and Levels to Note
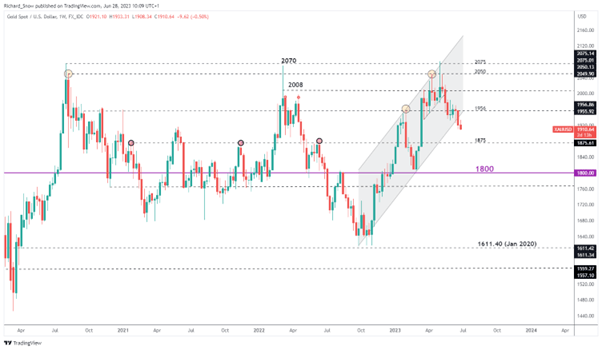
Gold has continued its decline that began after reaching an all-time high of 2081.82 in early May after a resurgence of regional banking woes in the US culminated in JP Morgan absorbing the troubled First Republic Bank. The move lower ran out of steam and entered into a period of consolidation near the lower bound of the ascending channel (refer to daily chart) before renewed bearish momentum resulted in a break and hold below the ascending channel on the weekly chart.
From current levels, 1875 appears as the most relevant level of support as it had acted as a pivot point on multiple occasions despite that coming in the form of resistance, capping higher prices at the time. Nevertheless, it is a crucial level for both bulls and bears. Now that prices have closed below the upward-sloping channel, the next level of resistance appears all the way at 1956 – a prior level that had kept bulls at bay.
Gold XAU/USD Weekly Chart
Source: TradingView, prepared by Richard Snow
Trade Smarter – Sign up for the DailyFX Newsletter
Receive timely and compelling market commentary from the DailyFX team
Subscribe to Newsletter
Textbook-like Retest Suggests Further Downside for Gold
Typically, breakouts and breakdowns have a tendency to retest the level that had just been broken, meaning pullbacks after breaks are often observed. Over the weekend geopolitical tensions picked up a notch in eastern Europe, seeing gold prices retest 1937 and the underside of the ascending channel before heading lower in subsequent trading sessions.
Prices now trade below 1915 which acted as support for the months of March and April last year. A close beneath this level on the daily chart adds to the bearish outlook, with ample room to run before the 1875 level and the 200 simple moving average comes into play. Resistance at 1937 on the daily chart.
Gold XAU/USD Daily Chart
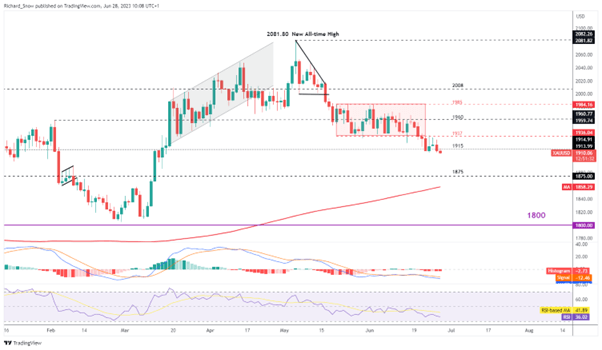
Source: TradingView, prepared by Richard Snow
— Written by Richard Snow for DailyFX.com
Contact and follow Richard on Twitter: @RichardSnowFX

