
Trade Smarter – Sign up for the DailyFX Newsletter
Receive timely and compelling market commentary from the DailyFX team
Subscribe to Newsletter
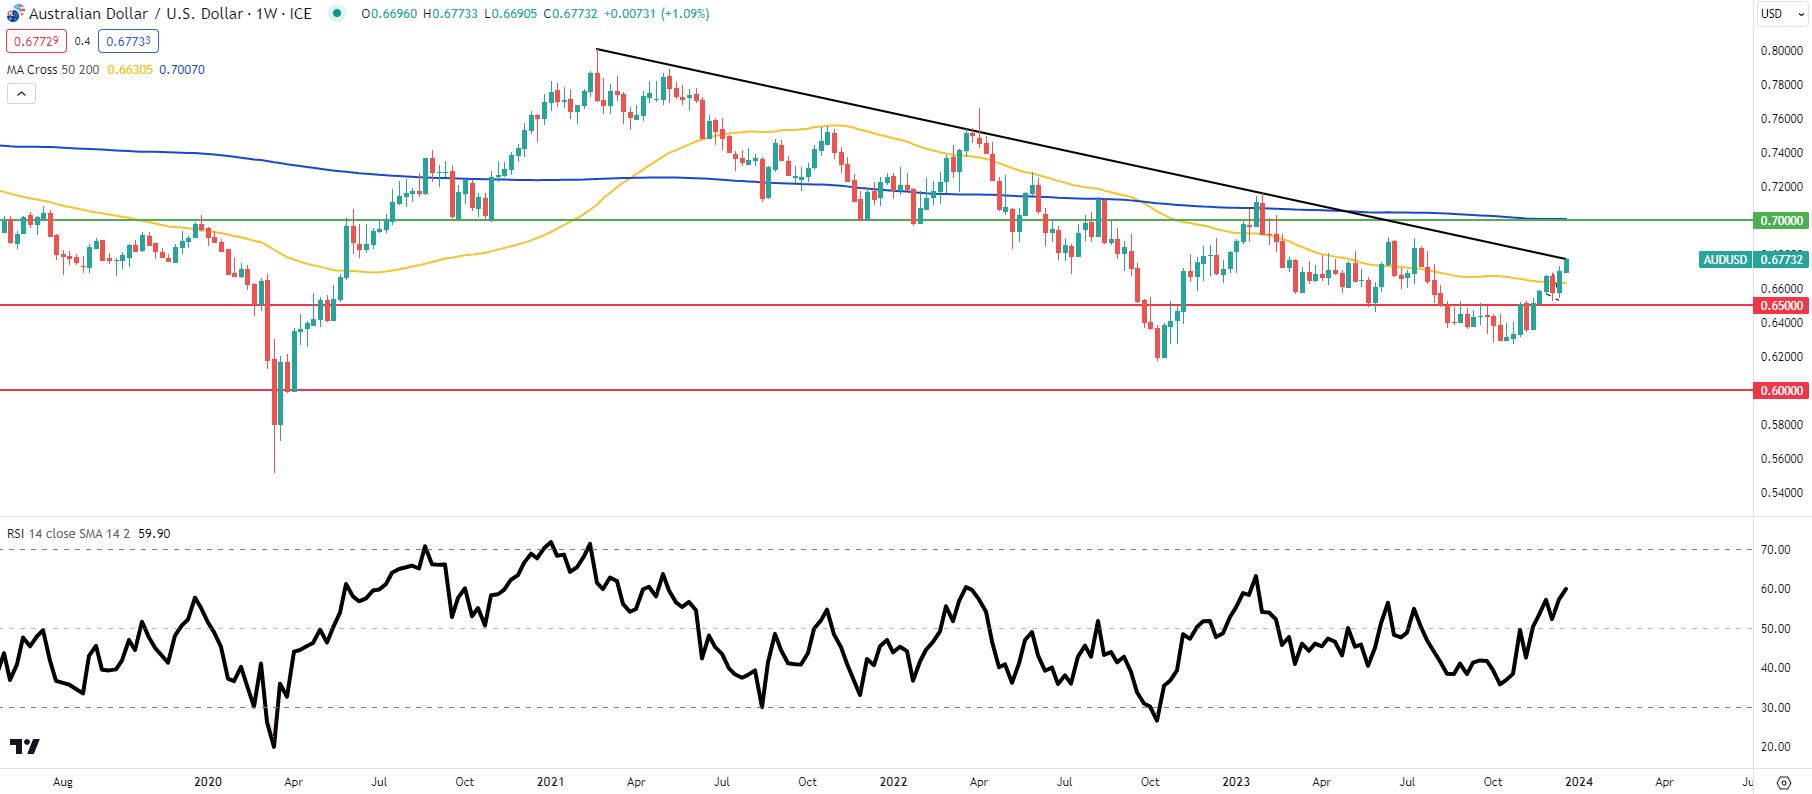
AUD/USD price action on the longer-term weekly chart now sees AUD bulls retesting the downward trendline resistance level (black) for the fourth time since February 2021. A major area of confluence like this could be central to traders and their directional biases in 2024. A confirmation close above could see a runup towards the 0.7000 psychological handle, while a failure may bring back into consideration the 0.6500 support level and beyond.
This article is specifically dedicated to analyzing the technical outlook for the Australian dollar. If you are interested in the currency’s fundamental prospects, request the full Q1 forecast now!
Recommended by Warren Venketas
Get Your Free AUD Forecast
AUD/USD Weekly Chart
Source: TradingView, Prepared by Warren Venketas
Focusing on the daily chart below, it is clear that the pair is in overbought territory as measured by the Relative Strength Index (RSI). I expect a pullback lower in January but with bullish momentum (prices trading above both 50-day and 200-day moving averages) in favour, downside may be short-lived. In conclusion, I do not expect any meaningful appreciation relative to current levels but my longer-term view as we head further into 2024 should facilitate upside sustenance for the AUD ceteris paribus.
AUD/USD Daily Chart
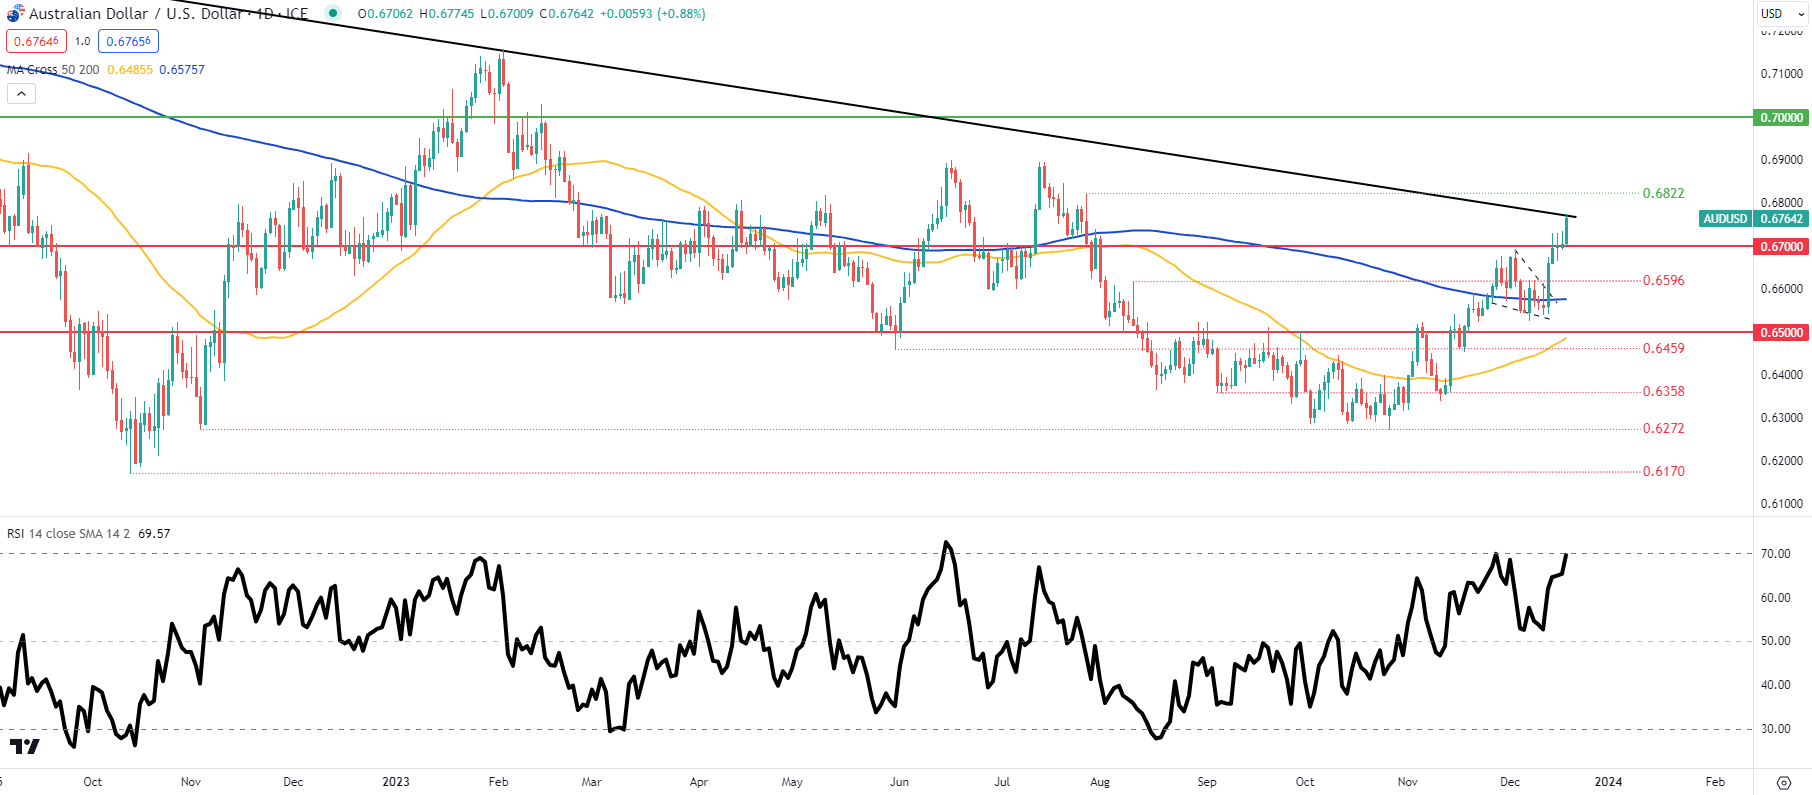
Source: TradingView, Prepared by Warren Venketas
Explore the impact of crowd mentality on FX trading dynamics. Download our sentiment guide to understand how market positioning can offer clues about AUD/USD’s trajectory.
| Change in | Longs | Shorts | OI |
| Daily | -2% | -9% | -6% |
| Weekly | -5% | -6% | -6% |
Key resistance levels:
- 0.7000
- 0.6822
- Trendline resistance
Key support levels:
- 0.6700
- 0.6595
- 200-day MA (blue)
- 0.6500

