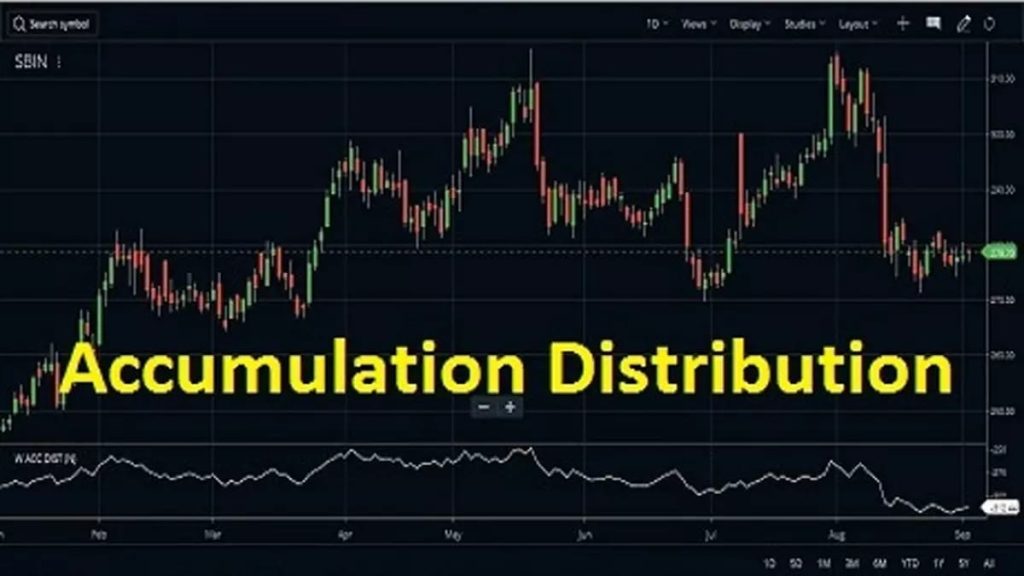
Accumulation Distribution Line: An introduction
The Accumulation Distribution Line or (ADL) for short is one of the best indicators to use when you want to know whether investors are accumulating (buying more) or distributing (selling) security you are interested in. It’s a simple yet powerful indicator that can show you at a glance whether the price for security has potential to move up or down in the near future and if your investment decision is valid or not.
This guide will explain everything about ADLs, including what they are, why they are useful, how to interpret them, and much more.

Founder of Accumulation Distribution Line
Developed by Marc Chaikin, the Accumulation Distribution Line is a volume-based indicator designed to measure the cumulative flow of money into and out of a security. Volume-based indicators like ADL measure how much buying or selling pressure that took place during a particular time frame.
Calculation of Accumulation Distribution Line
ADL can be calculated in three steps. First, calculate the money flow multiplier. Second, The money flow multiplier is multiplied by volume, we get the money flow volume. To get the Accumulation Distribution line (ADL), we add these volumes together. The money flow multiplier fluctuates between +1 and -1. Thus, it holds the key to the money flow volume and cumulative distribution line.
The multiplier is positive if the closing price is in the upper half of the high-low range and negative if it is in the lower half. This makes sense because when the price closes in the upper half of the range, there will be more buying pressure than selling pressure (and vice versa). The cumulative distribution line rises when the multiplier is positive and falls when the multiplier is negative.
Volume measures the number of shares traded in a given period; a dollar volume is equivalent to one share traded. Money flows occur when an investor buys or sells a security.
Interpretation of Accumulation Distribution Line
Accumulation Distribution Line measures money flow over time, multiplied by volume. High multiplier and high volume indicate strong buying pressure, which propels the indicator higher. Low negative numbers with high volume indicate heavy selling pressure. Money Flow Volume reflects the underlying price trend and confirms or contradicts it. Using a trend indicator can confirm a trend or cast doubt on its sustainability.
An uptrend in prices with a downtrend in the Accumulation Distribution Line suggests underlying selling pressure (distribution) that could foreshadow a bearish reversal on the price chart. A downtrend in prices with an uptrend in the Accumulation Distribution Line indicate underlying buying pressure (accumulation) that could foreshadow a bullish reversal in prices.
This pattern might be confirmed by an oversold reading for the oscillator at the same time as accumulation is occurring.
It can also signal a change in momentum and warn traders of impending reversals when it crosses above/below zero and diverges from changes in price direction.
Signals to trade opposite are given when the oscillator moves back into its normal range while accumulation remains at extreme levels during an uptrend or distribution continues unabated during a downtrend.
Trend Confirmation using accumulation distribution
Trend confirmation is a pretty straight-forward concept. The oscillator’s peaks represent periods of increased buying pressure while its troughs represent periods of increased selling pressure.
An uptrend in the Accumulation Distribution Line is shown by each oscillator’s peak higher than the previous peak. Likewise, a downtrend in the Accumulation Distribution Line oscillator’s trough lower than the previous trough.
Divergences
Bullish Divergence
A bullish divergence forms when price moves to new lows, but the Accumulation Distribution Line does not confirm these lows and moves higher. The result is a strong indication that buyers are accumulating shares while sellers are losing interest.
Bearish Divergence
On the other hand, a bearish divergence forms when price reaches new highs, but the Accumulation Distribution Line does not reach these highs and instead drops lower. The result is a strong indication that sellers are accumulating shares while buyers lose interest.
Trading Strategy of Accumulation Distribution Line Indicator
- Go Long when there is Bullish Divergence.
- Go Short when there is Bearish Divergence.
Advantages of Accumulation Distribution Indicator
- Using this indicator is relatively easy.
- It’s a good way to determine where the financial market is taking divergent steps.
- The A/D indicator is present in most platforms such as Trading view, MT4, and MT5.
Limitations of Accumulation Distribution Indicator
The A/D indicator doesn’t factor in prices changes from one period to the next, only highlighting the final price within the current period’s range. This creates some inconsistencies.
When a stock gaps down 25% on huge volume and the price oscillates throughout the day and still end in the upper part of its range, but down 21% from the prior close. Such a move would actually lead to an increase in A/D even though the stock dropped in value significantly.
Indicator divergences can last for a long time and are poor timing signals. When divergence appears between the indicator and price, it doesn’t necessarily mean a reversal is imminent. There may be a long wait for price to reverse, or the price may not reverse at all.
Download Accumulation Distribution excel sheet & Indicator MT4 and Amibroker
| Trading Platforms | Link to download Indicator |
| MT4 | Click Here |
| Amibroker | Click Here |
| Microsoft Excel Sheet | Click Here |


