Enjoy this post? Share the love.
If you are a long-term investor who was negatively affected by the 2022 bear market, there is a key indicator that can help you achieve better results in 2023—regardless of market conditions.
In this blog post, we explore the ins and outs of the 200-day moving average, including how it works, why it’s so effective, and how you can use it as an effective buy signal.
Most importantly, we’ll show you the key price levels to watch in 2023 for the main stock market indexes.
So whether you’re a seasoned trader or just starting out, this is a must-read for anyone looking to improve their chances of success and reduce risk in 2023 and beyond.
What is the 200-day moving average?
The 200-day moving average (200-day MA) is a popular technical analysis indicator that calculates the average price of a stock or index over the past 200 days. It is used to smooth out day-to-day price fluctuations, and provide a clearer picture of the dominant trend.
To calculate the 200-day moving average, you simply take the sum of the stock’s closing prices over the past 200 days and divide it by 200. The resulting average is then plotted on a chart, along with the stock’s actual price.
Simply put, the 200-day moving average is fantastic for quickly determining the long-term trend of the S&P 500, Nasdaq, and any individual stocks.
When used with other key indicators such as price action and volume, the 200-day moving average provides an excellent way to ensure you’re always on the right side of a stock’s trend.
Continue reading to discover how the 200-day MA works to reduce your risk, while increasing your odds of success.

Why is the 200-day moving average strategy so effective?
There are a few reasons why the 200-day moving average is such an effective and reliable technical indicator:
- It is a long-term indicator: By smoothing out short-term price fluctuations, the 200-day MA easily gives you a better sense of the underlying trend over a longer period of time. If you’re an investor with a long-term horizon, this allows you to focus on the “big picture,” rather than getting caught up in short-term noise. It’s also effective for swing traders following a trend-trading strategy.
- It is widely followed: The 200-day moving average has the potential to influence market sentiment because it is such a well-known indicator among traders and investors. Its popularity makes it a self-fulfilling indicator, as traders may buy or sell based on whether the price is above or below the 200-day MA.
- It can act as support or resistance: Most importantly, the 200-day MA is a highly reliable indicator of support or resistance (as the following charts will show). This can be useful for traders and investors looking to enter or exit positions based on whether an index or stock price is able to break through the 200-day moving average.
Overall, the 200-day moving average is a fantastic indicator due to its long-term perspective, widespread use, and potential to act as a level of support or resistance.
Now that you understand what the 200-day moving average is and how it works, let’s see it in action on charts of the main stock market indexes.
$QQQ: 200-day moving average of Nasdaq 100 Index
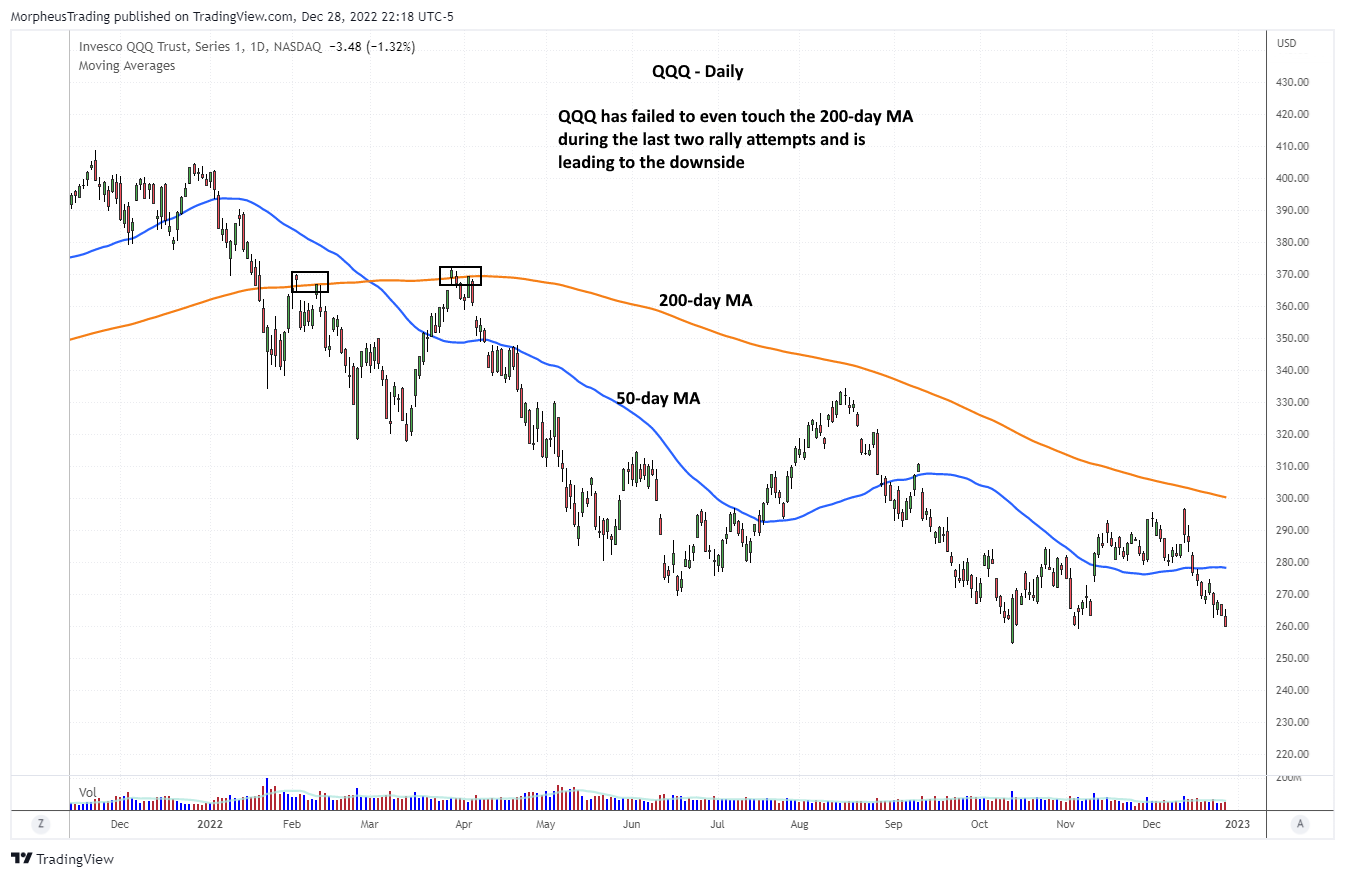
$QQQ, a popular ETF that tracks the Nasdaq 100 Index, showed the most weakness of all the major index ETFs in 2022. This is not surprising, as funds typically rotate out of tech growth stocks and into less volatile sectors in bear markets.
Below, notice that $QQQ fell below support of its 200-day moving average (orange line) in January, then ran into new resistance of that same level when stocks rallied a few weeks later.
$QQQ again tried to break out two months later, but resistance of the 200-day MA crushed the rally attempt each time:

It’s been 9 months since $QQQ touched the 200-day MA, but the next market rally attempt could quickly lead to a new test of Nasdaq’s 200-day moving average.
By the way, the $QQQ chart above clearly demonstrates how a prior level of support becomes the new resistance level—after the support is broken. The opposite of this basic rule of technical analysis is also true.
$SPY: 200-day moving average of S&P 500 Index
The SPDR S&P 500 ETF ($SPY) spent most of 2022 below its declining 200-day MA, but tested that resistance level a few more times than $QQQ.
As with $QQQ, each $SPY rally attempt failed after running into its 200-day MA, leading to a new wave of selling and lower lows every time:

After each rejection at the 200-MA, notice the price also fell back below the shorter-term 20-day MA within two weeks. Bear market rallies fall hard after they stall (just as pullbacks in bull markets lead to sharp rallies).
$DIA: 200-day moving average of Dow Jones Industrial Average
In bear markets, institutional funds typically rotate out of more volatile growth stocks and into blue chips. As such, it’s no surprise the Dow has been showing relative strength to the Nasdaq and S&P 500 indices.
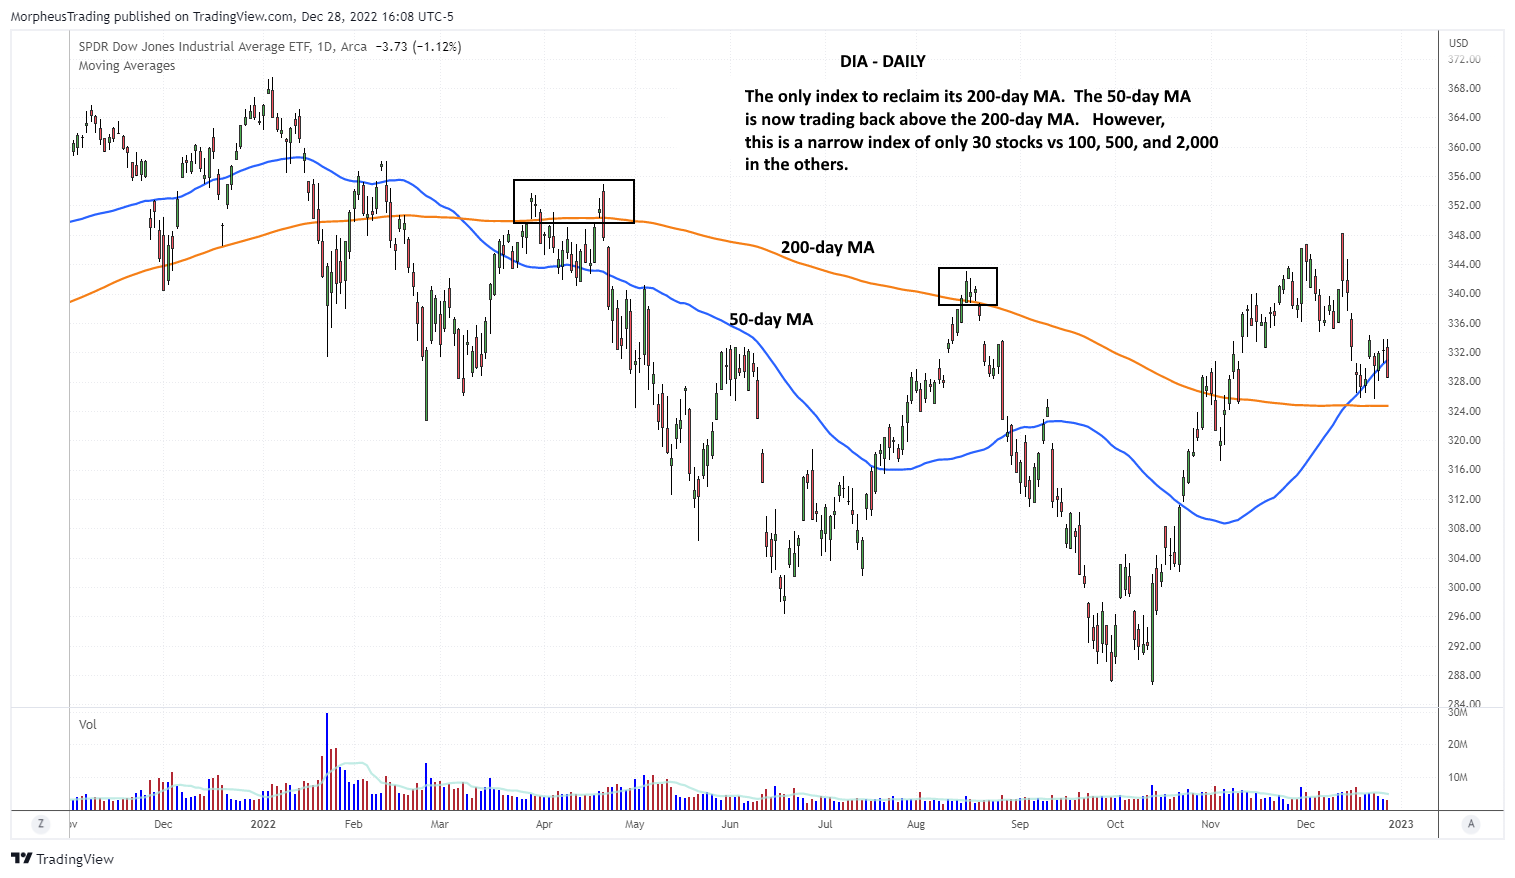
$DIA, an ETF that tracks the Dow Jones Industrial Average, is the only major index ETF currently trading above its 200-day MA.
$DIA also recently formed a golden cross pattern (bullish) when the 50-day MA crossed above the 200-day MA in mid-December 2022:

After $DIA reclaimed its 200-day MA in November, that former resistance level became the new support level. Notice how the price held above the 200-MA when the price pulled back in mid-December.
It’s positive that the Dow is currently holding above its 200-day moving average, but keep in mind the index is narrowly comprised of only 30 stocks.
$MDY: 200-day moving average of S&P MidCap 400 Index
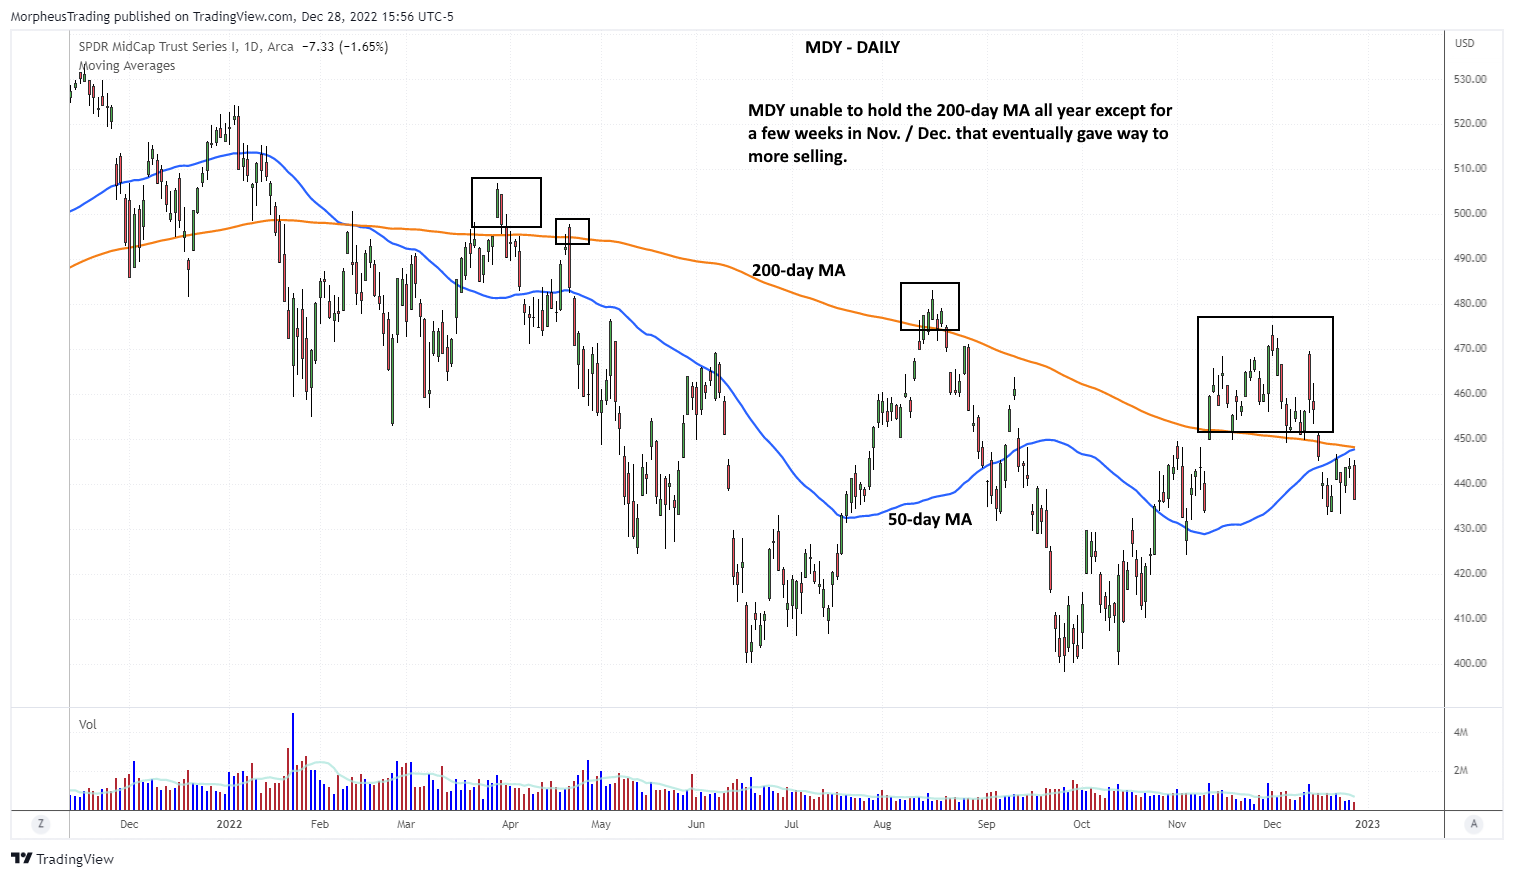
$MDY, an ETF that tracks the S&P MidCap 400 Index, reclaimed its 200-day moving average in early November and traded above it for a full month. However, continued selling pressure eventually caused $MDY to slip back below it.
On the chart below, notice how many times $MDY bounced off 200-day MA support before finally falling back below it in December (another example of prior resistance turning into new support):

Most of the stronger stocks currently on our Wagner Daily watchlist are mid-caps. This makes sense, as most large-cap tech stocks have either been setting new 52-week lows or struggling to even get back above their 50-day MAs.
$IWM: 200-day moving average of Russell 2000 Index
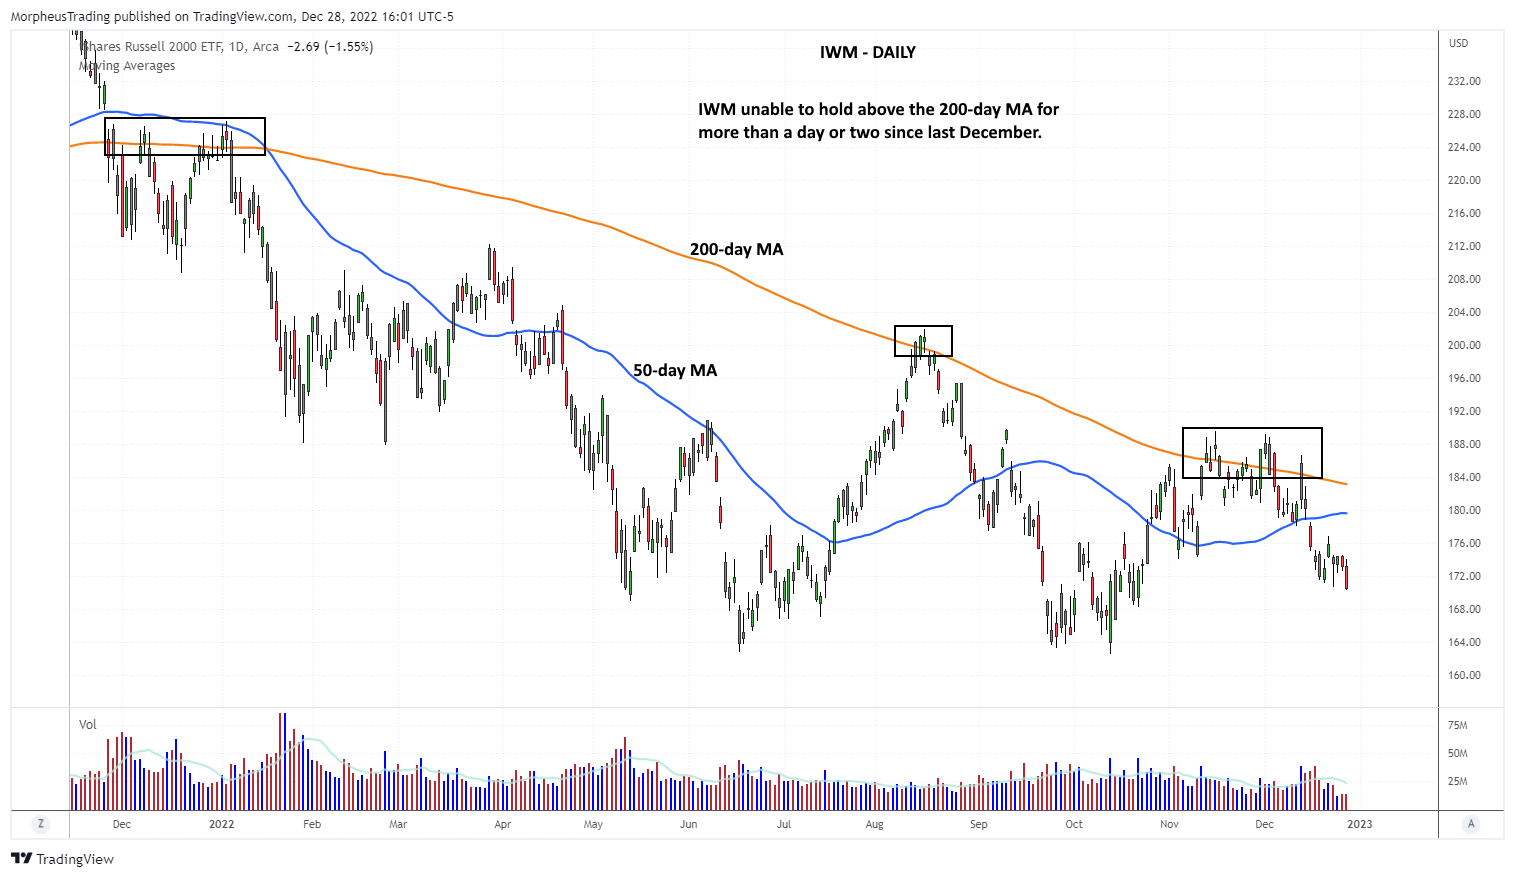
Like tech growth stocks, small-cap shares often underperform in weak markets. As such, the iShares Russell 2000 Index ETF ($IWM) showed similar relative weakness to $QQQ in 2022.
$IWM briefly popped its head above the 200-MA in the latter half of the year, but failed to hold above it more than a few days every time:

Using only the 200-day moving average indicator, we quickly determined that $QQQ and $IWM showed the most weakness, while $DIA and $MDY showed minor relative strength in 2022.
This is logical, as both large-cap tech and small-cap stocks are considered to be “risk on” plays, while blue chips and (to a lesser extent) mid-caps become more attractive in bearish markets.
200-day moving average levels to watch in 2023
As 2022 rolls to a close, all but one of the major indices (Dow Jones) are trading below their 200-day moving averages. Accordingly, we continue to remain mostly in cash (along with select, low-risk short setups) in our daily swing trading report.
However, when other market indexes start reclaiming their 200-day MAs, it will signal a shift in long-term trend. This would signal it may be time to start dipping a toe in the water on the long side.
Below are the current levels of the 200-day moving average for each of the major index ETFs:
- $QQQ – Resistance at $300
- $SPY – Resistance at $400
- $DIA – Support at $325
- $MDY – Resistance at $448
- $IWM – Resistance at $183
Write down these levels in a notebook or set price alerts on your trading platform to ensure you don’t miss the key reversal signal of the 200-day moving average.
Of course, remember that moving averages…well, move. This means the price levels above will obviously change as time progresses.
Best ways to use the 200-day moving average
In its simplest form, the 200-day moving average is a long-term trend indicator. If the price is above the moving average, it is generally considered to be in an uptrend. If the price is below the 200-MA, it is considered to be in a downtrend.
Additionally, traders use the 200-day MA to look for Crossovers, Divergence, and Golden Cross patterns.
Crossovers
One way to use a 200-day moving average is to look for crossovers, where the stock or index price crosses above or below the moving average. A stock price crossing above the 200-day moving average is typically a bullish signal, indicating the reversal of a long-term downtrend. Conversely, it is a bearish signal when the price crosses below the 200-day MA.
Divergence
Another way to use a 200-day moving average is to look for divergences, where the stock price moves in the opposite direction of the moving average. For example, if the stock price is making new highs but the moving average is not, this may be a warning sign that the uptrend is losing momentum. Similarly, if the stock price is making new lows but the moving average is not, this may be a sign that the downtrend is losing steam.

Golden Cross
A golden cross is a bullish technical signal that is calculated by plotting a short-term moving average, such as a 50-day moving average, on top of a long-term moving average, such as a 200-day moving average.
A golden cross pattern occurs when the short-term moving average crosses above the long-term moving average, indicating that the stock may be poised for a bullish run.
The golden cross is often seen as a “buy” signal because it indicates that short-term price momentum is strong, and may be continuing in an upward direction. This can be a useful tool for traders and investors looking to identify potential buying opportunities.
However, it is important to note that the golden cross is not a perfect indicator. Other analysis techniques should also be used to confirm the bullish signal.
Overall, traders may use the 200-day moving average as a buy or sell signal, depending on whether the security’s price is above or below the average. Others may use it as a reference point to assess the strength of the current trend, or to identify potential trend changes.
Note that some traders may also look for a “dead cross,” a bearish signal that is opposite of a golden cross.
Conclusion
The 200-day moving average is a simple, powerful, and widely followed technical indicator that helps you quickly determine the long-term trend of an index, stock, crypto, or any financial asset.
It can help to identify potential buying and selling opportunities, and can also provide important support and resistance levels for the price.
By smoothing out short-term price fluctuations and providing a long-term perspective, the 200-day MA is a fantastic tool for investors and traders looking to make informed decisions about their positions.
The indicator has proven to be highly reliable in the past, and will continue to be an extremely useful indicator in the future. Still, the 200-day moving average should always be used in conjunction with other key indicators, such as price action and volume, to get a more complete picture of the market.
Although it’s impossible to know which way stocks will go in 2023, you can be prepared to start buying stocks at the right time if/when the major indexes start moving back above their 200-day moving averages.
Join the Morpheus family by subscribing now to The Wagner Daily report, your one-stop shop for the hottest swing trade alerts and top-notch trader education since 2002.
Enjoy this post? Share the love.


