

To understand the 20% move keep aside all your current thinking, charts, indicator, MA, and stock phases. Start with a completely blank mindset.
Mark on the chart the 20% move using the following PCF
https://www.tc2000.com/~tSzZPq
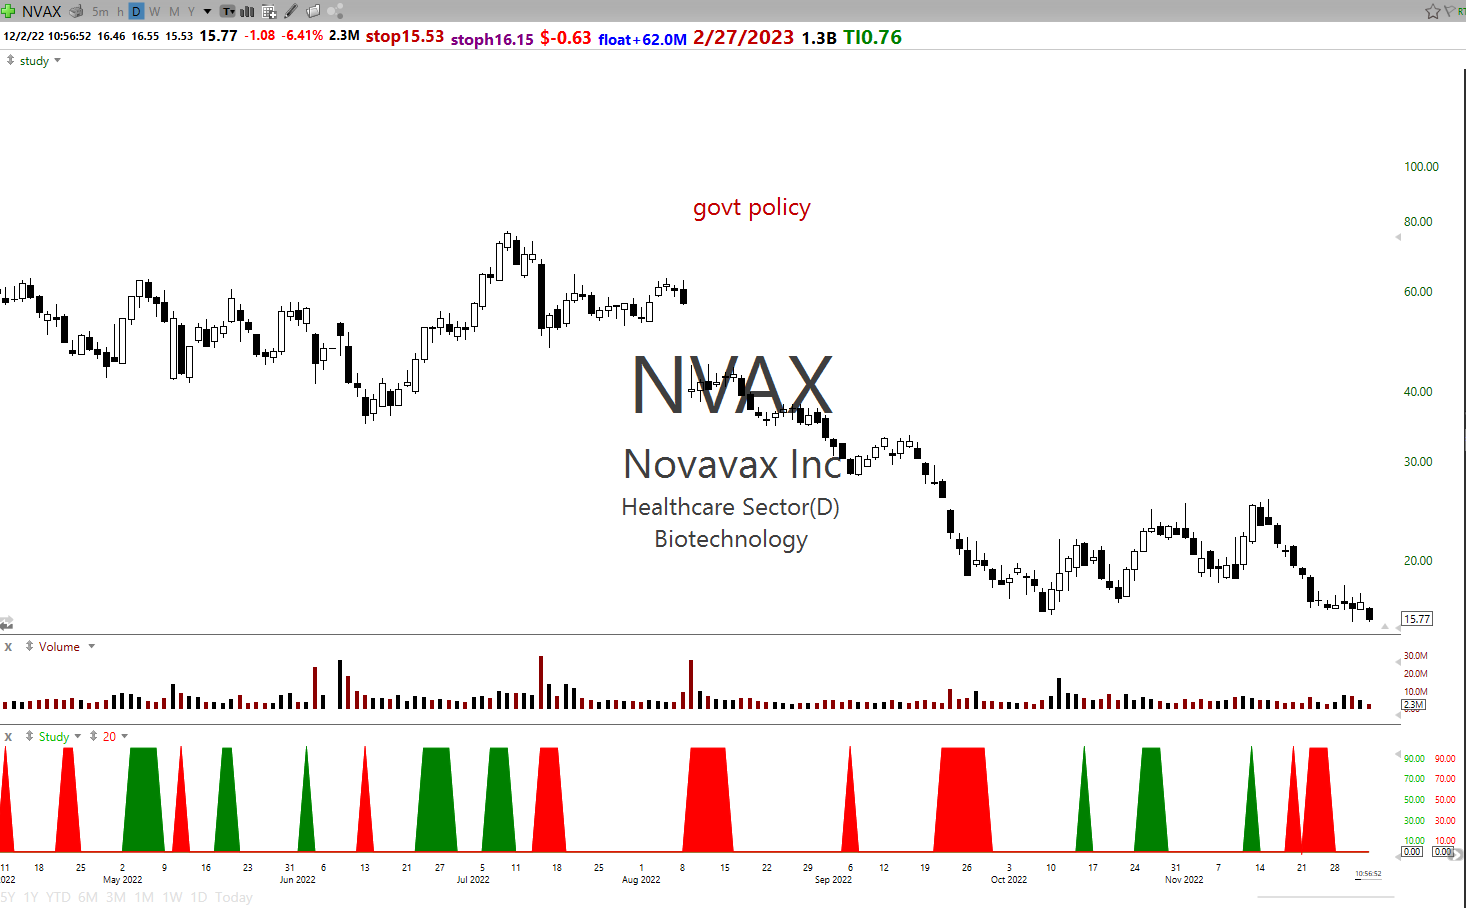
c/c5>=1.2 and minv3.1>100000 and c>=3 bullish
c/c5=<.80 and minv3.1>100000 and c>=5 bearish
This is how the chart will look.
Now study 500 to 1000 stocks with just this indicator on it.
Write down your observations.
https://stockbee.biz/tweet/602204/
https://stockbee.biz/tweet/602292/
https://stockbee.biz/tweet/602293/
https://stockbee.biz/tweet/602295/
https://stockbee.biz/tweet/602301/
https://stockbee.biz/tweet/602302/

