


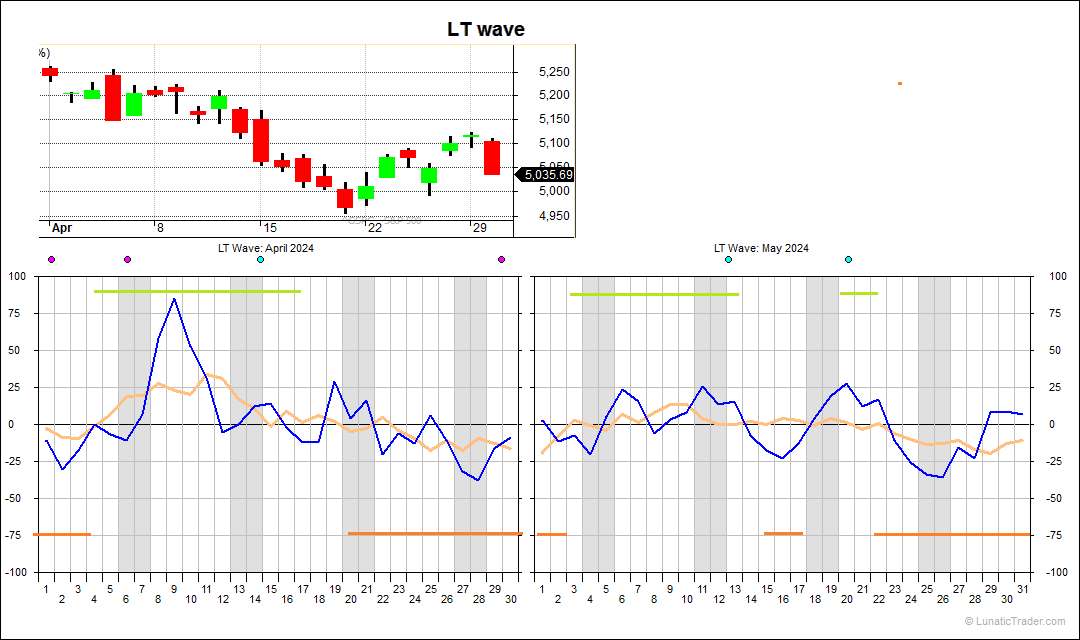
The LT wave did OK in April.
Weakness in the first days was evident. The subsequent stronger second week merely kept the index flat, signaling underlying weakness. On the 12 of April a 200 point decline started, a few days earlier than our graph indicated. And even though there were a few rebound days the month ended clearly on a weak note. Here is the LT wave for May:
Weakness in the first days, followed by a stronger second week again. There may be a dip around the 16th, and a few stronger days early in the third week. But just like for April the second half of May looks weak.
Normal caveats apply: the LT wave is experimental and purely based on natural cycles, so doesn’t use any market or price inputs. Don’t bet the farm on it.
Subscribe to our blog if you want to get an email each time we post new information. It’s free.
Join 965 other subscribers